|

|
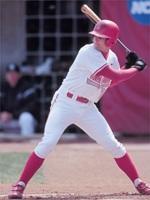
| Christian Snavely, sabermetric superstar |
2007 Hitters
2007 Pitchers
Well, this time they are four months late, but here are the 2005 statistics. Some slight changes this year. I have used
actual double and triple allowed stats, which allows the RC formula for pitchers to be the same as that for hitters, except
that we will estimate SB and CS. SB are estimate as 11.3% of (S+W) and CS as 4.3% of (S+W). I have also eliminated GRA and
just used %H to see if there was any "hit luck"(if such a thing even exists on this level). So here are the B10
totals:
G=572, AB=18985, H=5785, D=953, T=149, HR=332, W=1887, K=3070, SB=706, CS=269, IP=4727, R=3541, R/G=6.19, O/G=23.5, IP/G=8.3,
BA=.305, OBA=.368, SLG=.423
The Buckeyes went 40-20 for a .667 W%, second in the conference to UM(.689). They scored 385 runs and allowed 268, for
an EW% of .676, second in the conference to UM(.684). The Buckeyes had 364 runs created and 252 allowed to lead the B10 in
PW% at .678(UM second at .675).
2005 Hitters
2005 Pitchers
Finally, about three months late, are the 2004 stats. First, the B10 composite stats for 2004:
AB=18940,R=3271,H=5549,D=967,T=125,HR=393,W=1877,K=3415,SB=574
CS=233,IP=4775,G=575,R/G=5.69,O/G=23.7,IP/G=8.3
BA=.293,OBA=.357,SLG=.419
The Buckeyes went 36-25 for a W% of .590. In 61 games, they scored 356 runs and allowed 299 for a RPG of 10.74 and a
slope of .091(or, if you prefer to look at it that way, about 11 runs/win). That produces an EW% of .585. The Bucks had
371 RC and allowed 313 for a PW% of .587. They pretty much nailed their W% projections with their actual performance. As
you pursue the individual stats, you will be thankful to 30 major league scouting directors that Steve Caravati was not drafted
and you will hope that we can find some typical OSU starting pitchers to go along with our killer bullpen.
2004 Hitters
2004 Pitchers
Here are some rudimentary sabermetric stats for the 2003 Buckeye baseball team. There are hitting and pitching
stats. Here are just some quick stats on the entire team.
W L
W%
44 19
.698
R RA EW%
360 272 .635
RC RCA PW%
374 260 .675
As you can see, the Bucks have won a little bit more than their record might suggest, but not to an unusual or worrisome
extent. Here are just some random thoughts on some of the individual performances:
- Christian Snavely is an absolute star, hitting 335/488/675, +37 runs above the average B10 hitter
- The rest of the offense has performed at a fairly average level, but everyone is pretty much average--there are no dead
weights in the lineup
- Scott Lewis--what can you say? He's completely earned all of the accolades he has recieved, but unfortunately he
tore his elbow ligament. With the way pitchers have responded to elbow surgery lately, I feel cautiously optimisitc
about Scott coming back and dominating, whether at Ohio or in the minor leagues
- The Bucks pitching, without Lewis, is still fairly solid. Madsen and Newman, the top 2 starters, are each about
+20 runs. It's a shame Kyle Brown's shoulder is bothering him and Hanners has gotten the assignment for Game 3 of the
Super Regionals. He simply has not pitched well at all.
- Matt Davis, I love him, but he seems to be an example of the closer mystique extending to college ball. I don't
see what the Indians saw in him, but obviously I am pulling for him 100%.
Hitters
Pitchers
Big 10 team stats, 2000-2003
Explanation
There are a lot of sample size caveats here. One is that the college season, lasting only about 60 games, is less
than half as long as the ML season, so there is a larger margin of error here. The methods used, like Runs Created,
are also not as accurate with the collegiate data, and they were developed on a sample of just 30 teams(the 2001-2002) Big
Ten.
Anyway, the method for calculating W% here is linear, with slope = .279-.182log(RPG). Explanation of this is given
on the "W% Estimators" page under Sabermetrics on this site. The Runs Created method is a LW method, based on a BsR
method with the "+1 method". The BsR method used to create it was:
A = H+W-HR-CS
B = (2*TB-H-4*HR+.05*W+1.5*SB)*1.032
C = AB-H
BsR = A*B/(B+C)+HR
The marginal values came from the Big 10 totals for 00-02, and are:
RC = .61S+.95D+1.29T+1.51HR+.45W-.131(AB-H)+.26SB-.44CS
For pitchers, this formula was used, but with averages assumed for S, D, T, AB, SB, and CS, making it significantly less
accurate then the batter RC formula. Anyway, that formula turns out to be:
RC = .7H+.81HR+.46W-.367IP
The values for RA and all of its variants are based on assuming the 2003 B10 average IP/G, and the batter's RG figure
comes from the 03 B10 average of (AB-H+CS)/G.
GRA, the DIPS-like figure, is included, even though I have no idea if the DIPS principles hold for collegiate play and
have not seen nor done any research on this topic. It is quite possible that it does, but it is also quite possible
that it does not. Publishing the estimate does no harm one way or another.
|


